FUNDAMENTAL TO REVENUE PROTECTION MEASURES IN ELECTRIC, WATER AND GAS UTILITIES
Industrial and Commercial (I&C) consumers account for a very small percentage in terms of numbers, but their revenue contribution is very significant. Thus, any error in the metering system, intentional (fraud) or unintentional (system error) needs to be detected in time and rectified, to avoid delayed revenues and legal disputes. A revenue-linked measure called Earning Per Meter (EPM) captures the significance of this segment and would highlight the importance of Data Analytics and its benefits.
Also, with the implementation of AMR/AMI projects, and increased granularity of data, the volume of data increases exponentially, and the investment would be wasteful, if the data is not analyzed in time, to detect errors and loss of revenue. Here we outline a fundamental principle/criteria for initiating various Revenue Protection Measures (RPM) based on EPM. Although the discussions revolve around the electric utility business, the same can be extended to any other utilities like Water and Gas; wherever there is a commercial transaction between the utility and the consumer based on an interface meter.
INTRODUCTION
In any distribution system, the two clearly identifiable entities are the Utility Network and the Revenue Management System. All systems and technologies like sub-station automation, AMR, Operation & Maintenance (O&M), etc., are bounded by these two entities. In order to ensure that the entire energy pumped into the distribution segment is effectively measured and commensurate with the revenue collected, we need to capture data at all entry and exit points. In this chain, the metering system at the consumer premises, which becomes the boundary point for the utilities, becomes an important point to measure, monitor, and analyze.
JUST TO STEP ASIDE AND THINK ABOUT THE METERS …
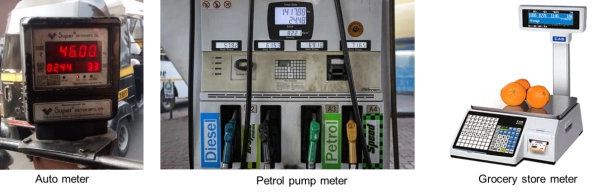
A meter is the only interface between two entities in many of the transactions – be it an auto meter or a meter in the petrol pump or the grocery store weighing machine which perhaps shows the weight and the amount. As human beings, all our eyes are at the display, while the transaction is in progress; and many of us, by experience, are able to see if there is an anomaly in the measurement – the auto meter is going fast or the rates of the fruits are high, and many of us do question the correctness of the numbers. But are we able to do the same for the electric, water or gas meters?
CONSUMER CATEGORY AND REVENUE ANALYSIS
Consider three major states in India - Uttar Pradesh, Madhya Pradesh, and Maharashtra, and their consumer distribution and corresponding annual revenue are shown in Table 1.

Fig. 1 Map of India showing three states of UP, MP, and Maharashtra
Table 1: Category of consumers and the annual revenue
Important observations are
- The total number of domestic consumers is about 4.4 Crores, while the revenue contribution is Rs. 31,645 Crores per annum.
- The number of LT industry is about 6.6 lacs, with annual revenue of Rs. 13,549 Crores.
- The High Voltage (HV) Industry accounts for a revenue of Rs. 35,168 Crores, with only 29,765 consumers.
- Railways with mere 107 metering points account for a revenue of Rs. 3,566 Crores, annually.
- In terms of % of the share, considering only the domestic and HV Industries, the domestic consumers account for 91% in numbers, with a revenue of 33%, but the HV industries account for 0.06% but contribute 36% of the total revenue, as shown in Table 1 and Fig. 2.
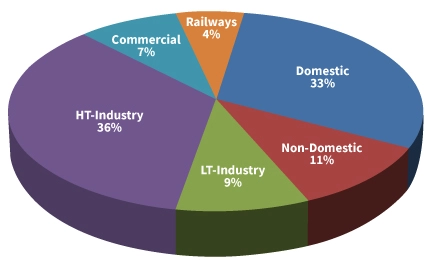
Fig. 2 Revenue distribution of different categories of consumers
WHAT DO THESE NUMBERS AND PERCENTAGES TRANSLATE TO?
In terms of revenue protection measures and other customer satisfaction initiatives, the utility has to take care of only 29,765 consumers to protect the revenue of Rs. 35,168 Crores, while the same utility has to keep a watch on 4.4 Crores of consumers to protect a revenue of Rs. 31,645 Crores – that is the reality. The same holds true for any of the technological interventions that a utility wishes to make, like Advance Metering Infrastructure (AMI) or any other value-added services for better customer satisfaction.
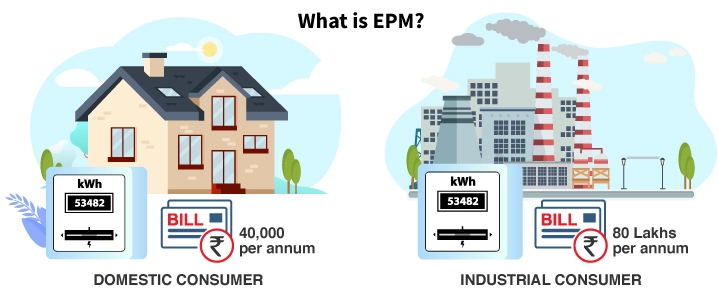
WHAT IS EARNING PER METER (EPM)?
Meter is the only interface between the utility and the consumer and based on the revenue transacted by a particular meter, we can assign a cost function for the same. Thus, Earning Per Meter (EPM) defines the revenue potential of the meter or in other words the intrinsic value of the meter. This is similar to Earning Per Share (EPS) which is used to assess the company’s profitability and determine its stock price.
Table 2 shows the EPM for various categories of consumer meters for the same three utilities in India.

Table 2: Category of consumers and their EPM values
Some of the important observations are:
- EPM of Rs. 7,1178 for a domestic consumer indicates the average annual income from a single domestic consumer.
- On the other hand, an EPM of Rs. 118 lacs for a High Voltage Industry indicates the average revenue per consumer in this segment.
EPM of an HV industry is about 1600 times that of a domestic consumer, signifying the importance of the HV industry segment.
Besides, in terms of the difference between material and intrinsic values, an HV industry meter in terms of the cost may be about Rs. 20,000, but the moment it is installed in the HV industry premises as part of the revenue chain, then its intrinsic value is Rs. 118 lacs; thus, all efforts and interventions as required to protect an asset of Rs. 100 lacs should be accorded to the safety and correct functioning of this meter. In the same breath, any investment in data analytic tools that help utilities to keep a watch on potential revenue leakages should be well considered.
CONCLUSION
All utilities, be it electric, gas, or water, supply a commodity to consumers, based on their requirements, and this commercial transaction is measured and recorded by a meter, based on which the business accounts are settled. Any inaccuracy, malfunction or tampering can impact the revenue, and thus, the meter and its data have to be protected and safeguarded.
Any effort in this direction depends on the meter’s intrinsic value and associated revenue potential. Earning Per Meter (EPM) is a definitive quantity and can be well used to make investments either on the meter itself or its associated functions, like data analytics or the building up of AMI. SANDS data analytic tool enables utilities to take timely action on any potential loss of revenue.
Note: All data presented are compiled from the Annual Revenue Requirement (ARR) filed by the electric utilities before their respective Electricity Regulatory Commissions (ERC).