
Beyond the Trendline: How
SANDS Used ML-Based State
Detection to Deliver Deeper
Insights for a Precision
Manufacturer
Customer Context: High-Speed Spindles, High Stakes
A leading precision components manufacturer uses ultra-high-speed CNC spindles—rotating up to 95,000 CPM—to machine fuel injector nozzles. In such setups, undetected spindle issues can trigger: unplanned downtime, quality deviations, and damage to expensive direct-drive motors.
SANDS had deployed its ARGUS Online Monitoring System for real-time vibration monitoring. While the system was capturing valuable data, the customer flagged a common issue:
“The trendline is useful, but we can’t tell what’s happening during idling or tool changes. The data’s too mixed.”
To resolve this, SANDS engineered and deployed a machine learning-based enhancement—within days.
The Problem: Trendlines That Blur Critical Context
Conventional trend plots combine data from all operational modes—power-off, idling, and machining—into one curve. This makes it nearly impossible to isolate actionable patterns.
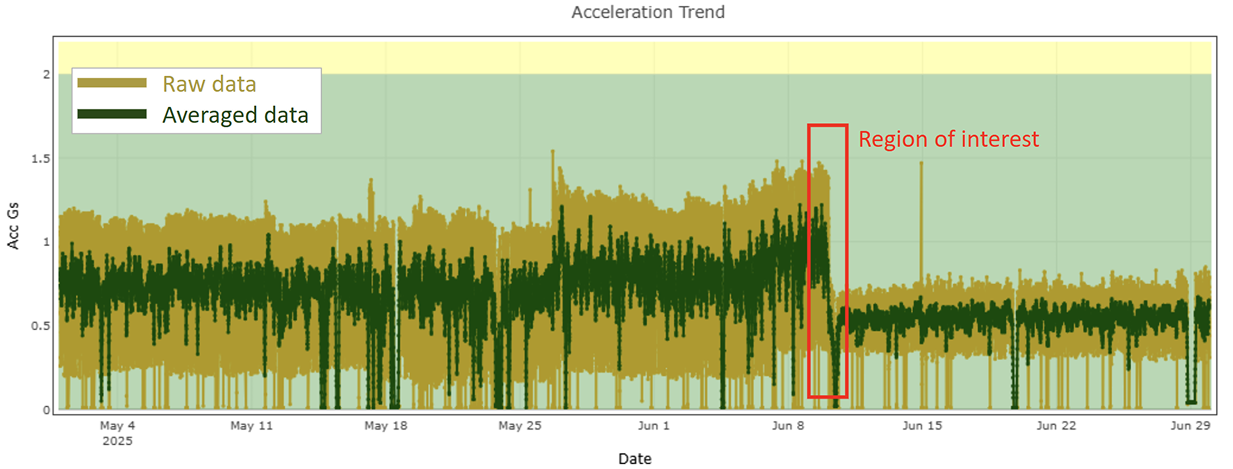
Figure 1: Raw Acceleration Trend Overlaid with Average
The Solution: ML-Based State Segmentation
To solve this, SANDS implemented a custom ML clustering model that automatically segmented vibration data into:
- Red: Power-Off
- Blue: Idling
- Black: Operative (Machining)
This was achieved without any external inputs or PLC signals—entirely from vibration patterns.
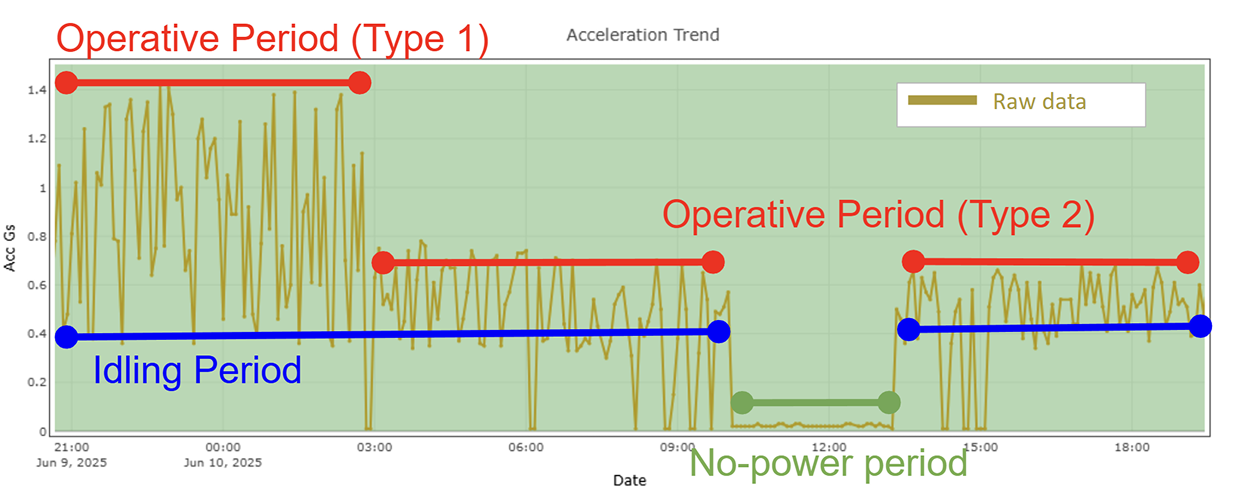
Figure 2: Zoomed View showing distinct machine states
From Chaos to Clarity: Trendlines by State
Looking at long-term trends in raw form can feel overwhelming.
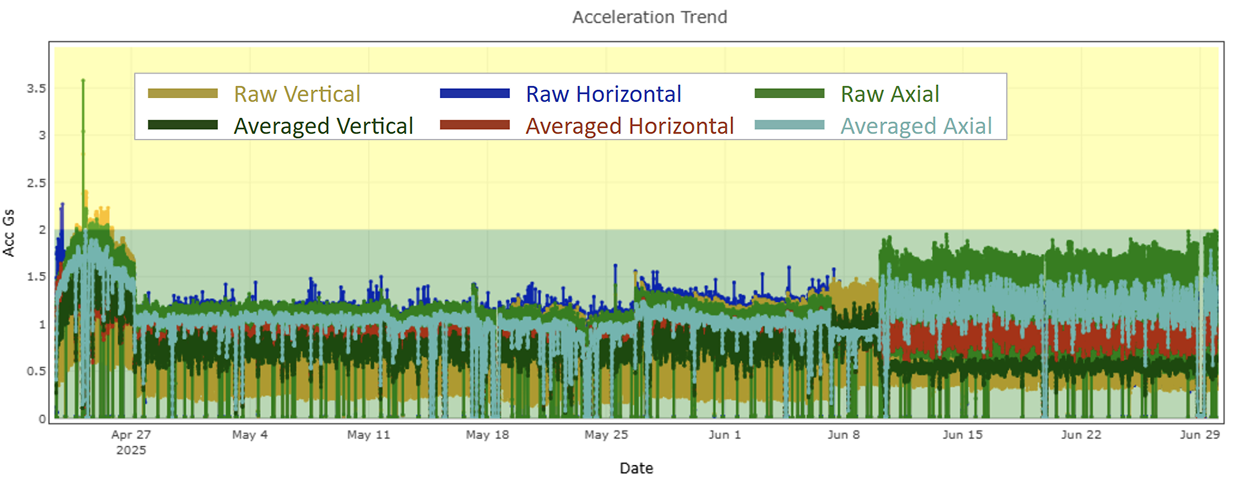
Figure 3: Two Months of Raw Acceleration Data
But once the ML-classified trendlines were layered in, distinct patterns emerged.
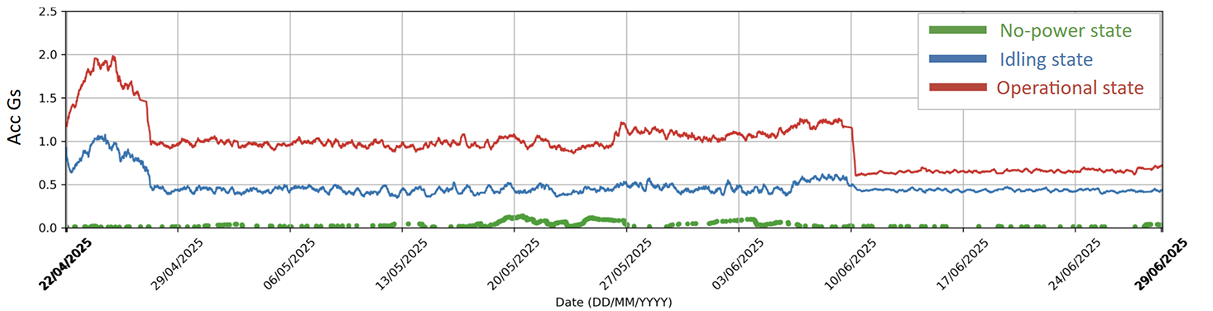
Figure 4: Trendlines by ML-Inferred State
What the Plant Team Saw: Insights with Context
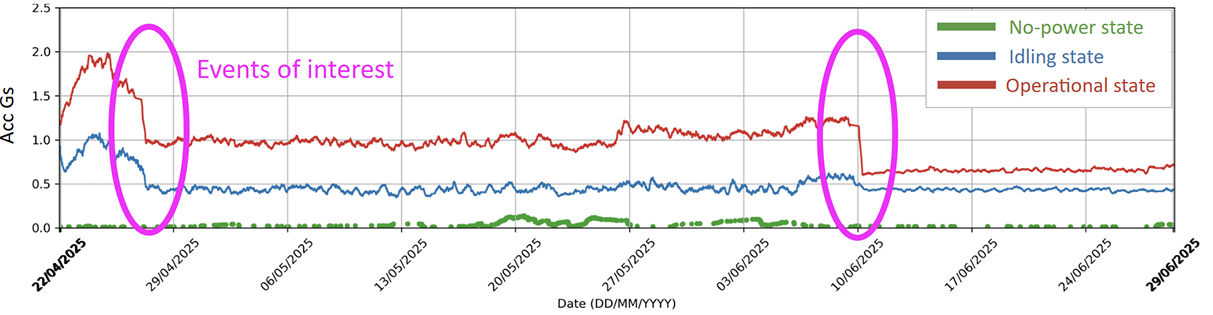
Figure 5: Highlighted events with abnormal behaviour
- Left Region: Both idle and operative trends rise → Suggests machine-wide anomaly (e.g., fixture or structural issue).
- Right Region: Only operative trend changes → Indicates a load-induced fault, such as tool wear or imbalance during machining.
The ML-based classification helped isolate when and under what conditions the machine behavior changed something raw trendlines couldn’t provide.
The SANDS Difference: Value Beyond the Sensor
This enhancement wasn’t part of the original scope. But when the customer voiced a pain point, SANDS responded with
- A focused engineering sprint
- An in-house ML model trained on existing ARGUS data
- A deployed solution—no extra hardware or integration required
“We were able to finally correlate changes to real spindle activity. That helped us take action faster.” — Maintenance Lead, Customer Facility
Takeaway
This case shows how SANDS doesn’t just deliver data—it delivers insight. With ML-powered condition monitoring, customers get more than graphs: they get clarity, confidence, and control.