
Rapid Vibration Diagnosis
Using ARGUS at a High-
Speed Print Facility
During a live demonstration of the ARGUS Portable Vibration Analyzer at one of the country’s largest print media facilities, a maintenance team member casually mentioned a recurring mechanical noise in one of the press lines. This prompted an impromptu diagnostic session — one that would showcase the power of ARGUS to deliver actionable insights within minutes, without any planned downtime or pre-scheduled monitoring.
What followed was a structured yet rapid analysis involving data acquisition, frequency-domain evaluation, and expert confirmation — all completed in a single visit.
Understanding the Machine Layout
The press consists of two mirrored print units, each containing two blanket cylinders and two plate cylinders. Paper moves vertically between these stacked units during operation. Sensors were deployed only on Cylinder Side 1, as the gearbox and Cylinder Side 2 were physically inaccessible. Based on accessibility, the diagnosis focused solely on the rollers of Cylinder Side 1.
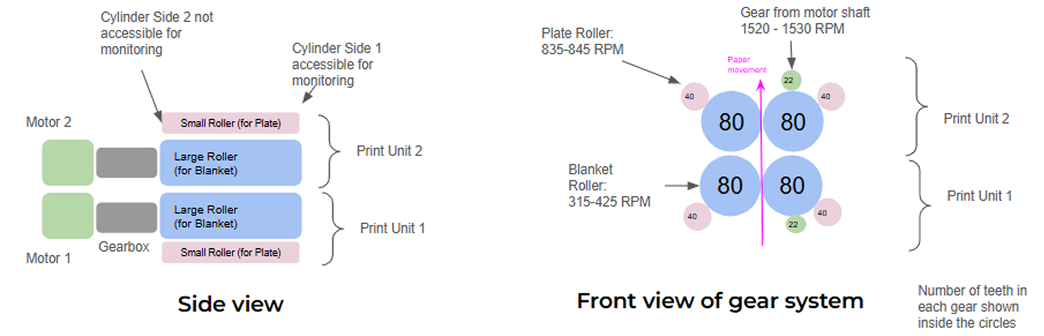
Figure 1(a): Schematic Diagram of the Printing Machine
Figure 1(b): Schematic Diagram of the Gear Setup
Figure 2(a): Schematic Diagram of the Printing Machine
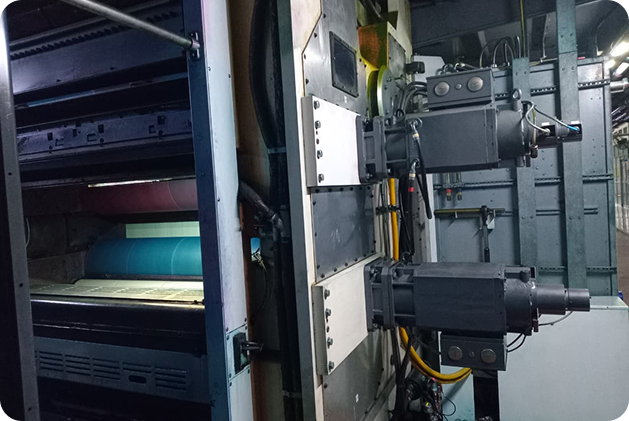
Figure 2(b): Schematic Diagram of the Gear Setup
Step 1: Establishing a Healthy Baseline
To begin, ARGUS sensors were deployed at the drive and non-drive ends of the motors powering the two print units. The goal was to verify motor condition and rule out coupling faults or imbalance.
Results showed motor vibration levels well within acceptable thresholds, confirming that the drive system was not the source of the unusual noise.
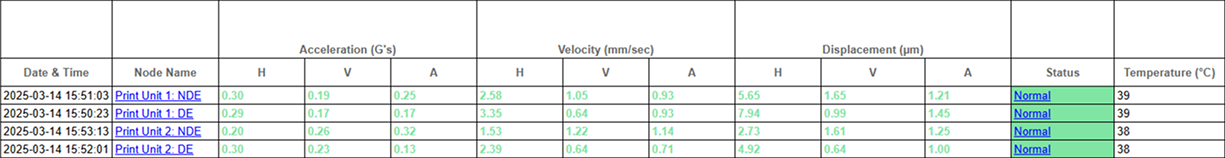
Table 1: RMS Acceleration, Velocity, Displacement of Motors in Unit 1 and Unit 2
Step 2: Mapping Access and Strategy
Due to structural limitations, only the rollers on Cylinder Side 1 were accessible. Rather than delay the diagnosis, the team adopted a focused approach: analyze the accessible rollers across both print units, compare results, and look for asymmetry or elevated vibration.
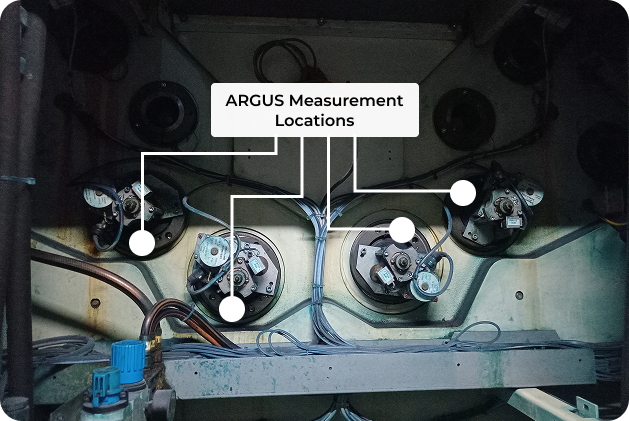
Figure 3: Sensor Deployment position on the accessible end
Step 3: Reference Measurements on Print Unit 1
Print Unit 1, which exhibited no symptoms or reported issues, was used as a baseline. ARGUS captured data from four nodes:
- Plate Cylinder – Left Top (Print Unit 1)
- Blanket Cylinder – Left Bottom(Print Unit 1)
- Blanket Cylinder – Right Bottom (Print Unit 1)
- Plate Cylinder – Right Top (Print Unit 1)
- Fmax: 1300 Hz
All readings showed low RMS values across displacement, velocity, and acceleration, providing a solid reference for comparison.
Step 4: Elevated Vibration in Print Unit 2
The same four nodes were measured in Print Unit 2. Two of them — Plate Cylinder – Left and Blanket Cylinder – Right — exhibited elevated displacement and velocity RMS. ARGUS’s built-in status logic flagged these points as marginal to critical.
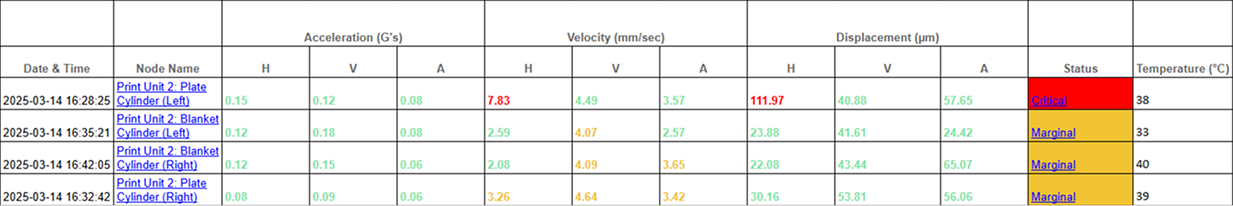
Table 2: Print Unit 2 Roller Vibration Summary
Step 5: Frequency Spectrum Analysis
To identify potential fault types, the ARGUS velocity spectrum was analyzed with an Fmax of 250 Hz. The spectrum showed moderate peak at ~5.3 Hz (Amplitude: 1.7 mm/s) — consistent with expected values for the Fundamental Train Frequency (FTF) of bearing cages. These peaks suggest a likely incipient bearing fault involving cage damage.
Additional peaks at 6.92 Hz and 14.67 Hz corresponded to the 1× rotational speeds of the blanket and plate rollers, respectively, and are considered normal machine components rather than fault indicators.
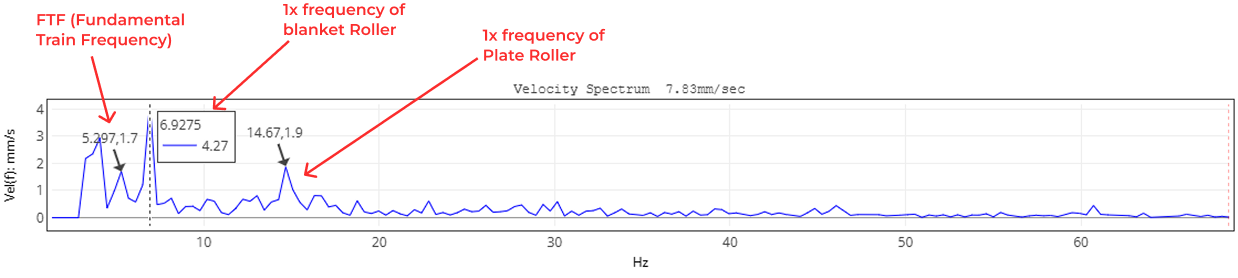
Figure 3: Velocity spectrum showing 1× roller speeds and bearing cage frequency (FTF)
Step 6: High-Frequency Confirmation Using Acceleration
To further validate the fault diagnosis, high-frequency acceleration data was analyzed up to 10 kHz. The acceleration spectrum revealed clear gear mesh activity around 3000 Hz, confirming mechanical interaction between meshing components. The corresponding time waveform exhibited periodic bursts, characteristic of impulsive excitation — often associated with minor gear tooth damage or meshing irregularities.
These results supported earlier findings and reinforced the need for a physical inspection during the next maintenance window.

Reference: Table 3 RMS Acceleration, Velocity, Displacement of the Plate Cylinder Top at 10 kHz Fmax
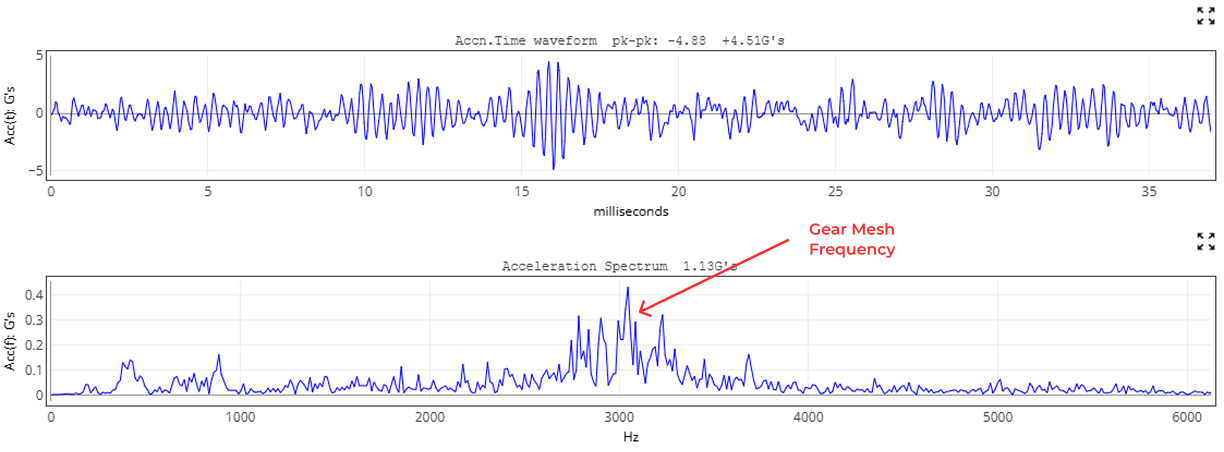
Figure 4: Acceleration waveform and spectrum confirming gear mesh activity near 3 kHz
Root Cause and Expert Validation
ARGUS diagnostics identified the following issues:
- A developing bearing defect at the Plate Cylinder – Left (Print Unit 2).
- Gear meshing irregularities at the Blanket Cylinder – Right and Plate Cylinder – Right (Print Unit 2).
An independent CAT-III certified vibration analyst reviewed the ARGUS data offline. Their conclusions were consistent. They confirmed bearing fit issues and meshing inaccuracies in the same locations
This agreement between AI-assisted on-site diagnosis and expert offline review validated the reliability of the ARGUS-based workflow.
Outcome
- The fault was diagnosed in less than one hour
- No downtime occurred
- The print line was flagged for proactive inspection
- The on-site ARGUS demo turned into a live diagnostic case study
This engagement highlights how rapid edge-based diagnostics, combined with domain knowledge, can transform how industrial plants handle emergent issues — from reactive to predictive.