Detecting Electrical Faults in
EV Paint Shop Pumps Using
Vibration Data
Overview
During a live demonstration of the ARGUS Portable Vibration Analyzer at an EV three-wheeler assembly plant, the maintenance team suggested collecting vibration data from a centrifugal pump used in the paint shop’s water circulation system. Confident in its health, they remarked that this equipment is under normal condition.
Within minutes, ARGUS revealed a spectral signature suggesting an electrical fault in industrial motors. The maintenance team, visibly surprised, noted that the motor had been replaced just last year. The machine showed no audible symptoms, yet the system picked up harmonics of the 50 Hz power supply — invisible to the naked ear, but clearly visible in the vibration frequency spectrum.
The pump is a mission-critical utility pump in EV manufacturing, operating 24×7. Although a backup pump exists, any failure would require flushing and switchover — disrupting paint operations. The customer expressed strong interest in permanent monitoring after witnessing the diagnostic insight live.
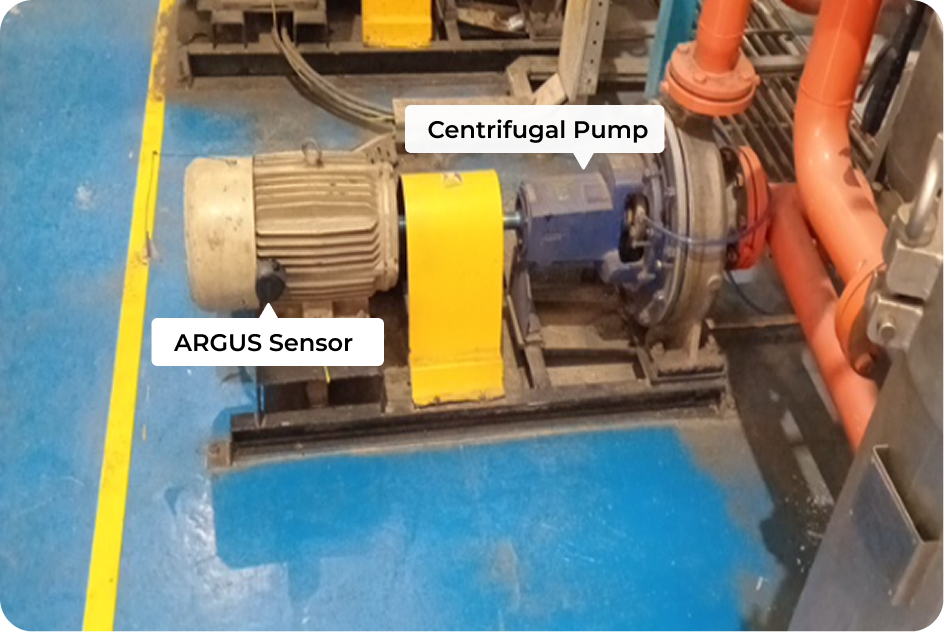
Figure 1: Centrifugal pump under monitoring
Diagnostic Findings & Engineering Recommendations
Measurements were taken at Pump Drive End (PDE), Pump Non-Drive End (PNDE), Motor Drive End (MDE), and Motor Non-Drive End (MNDE). All points showed vibration levels within acceptable range, except MNDE, which showed a slightly marginal reading in Acceleration. Figure 2 shows the Acceleration, Velocity & Displacement measurements.
Although mechanical parameters appeared normal, FFT vibration analysis revealed prominent peaks at: (which means 2X line frequency and its harmonics):
- 100 Hz
- 200 Hz
- 300 Hz
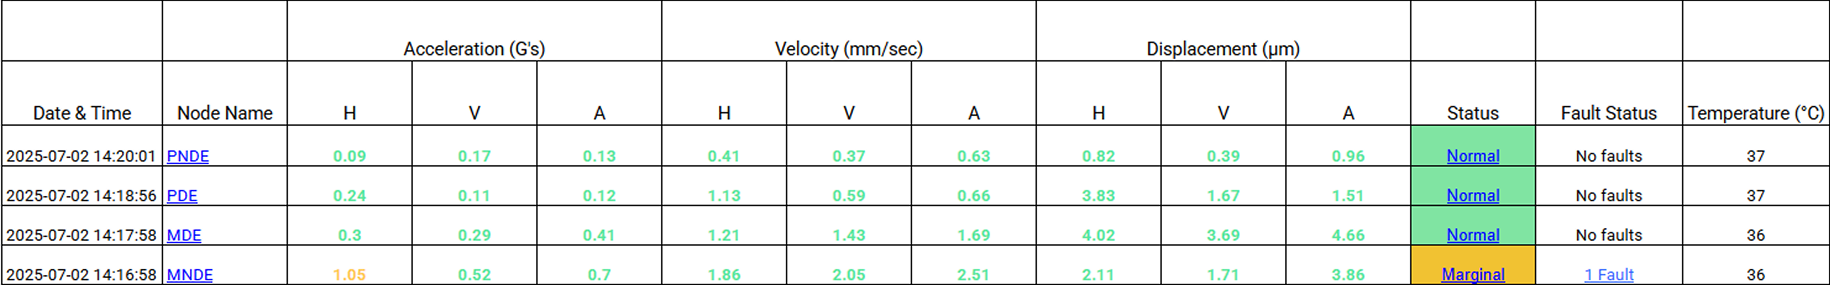
Figure 2: Acceleration, Velocity and Displacement RMS values as measured by ARGUS Portable Vibration Analyzer
These harmonics — exact multiples of the 50 Hz supply frequency — are characteristic of electromagnetic anomalies in electric motors, not mechanical issues. These patterns indicated electromagnetic anomalies such as rotor bar or stator winding faults. Figure 3 illustrates the full FFT spectrum, with visible harmonic peaks at 100, 200, and 300 Hz.
Importantly, no bearing fault frequencies (BPFO, BPFI, BSF, FTF) were present, eliminating common mechanical fault sources like imbalance or misalignment.
Test Settings:
- RPM: 1466
- LOR: 3200
- Window: Hann
- Number Of Samples (N): 8192
- Fmax: 1300 Hz
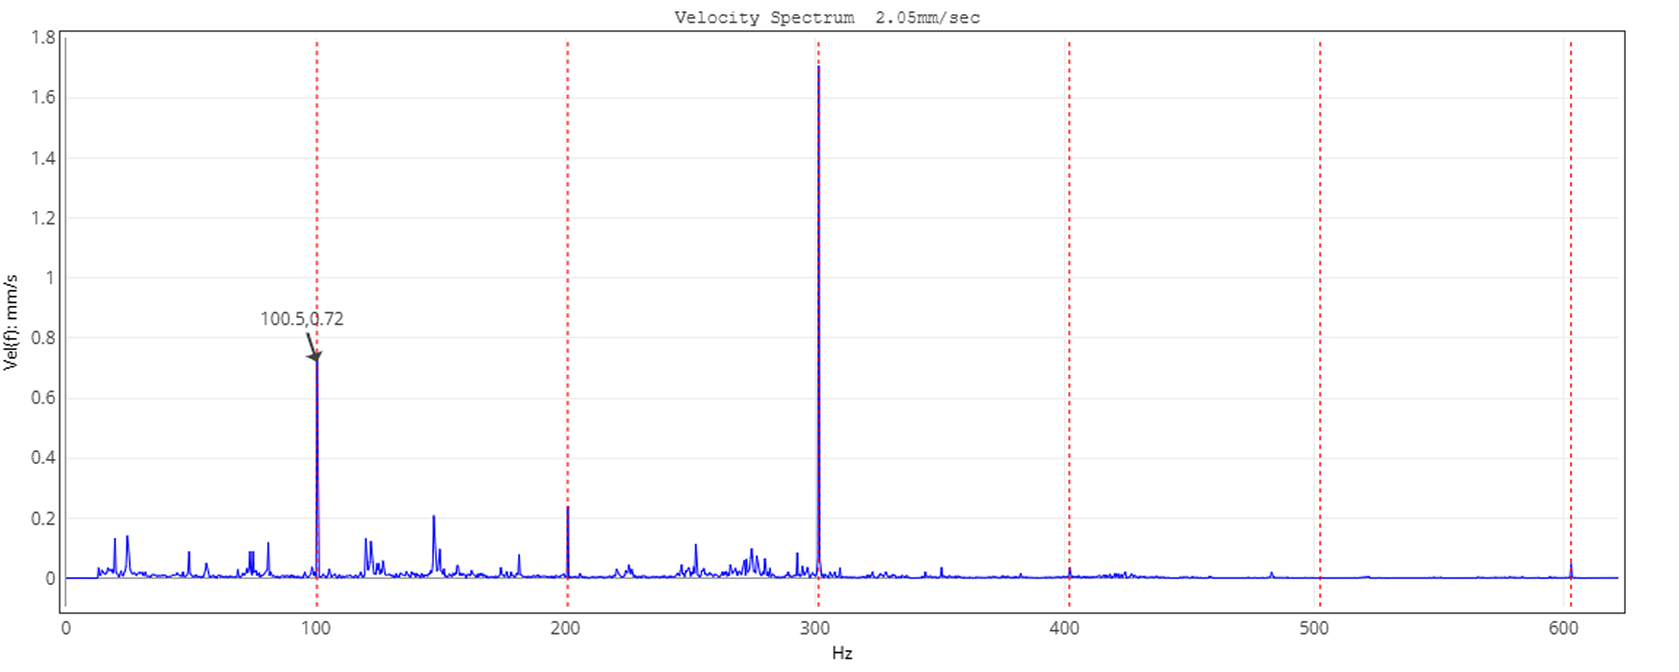
Figure 3: Velocity spectrum with zoomed-in view showing peaks at 100Hz, 200Hz, 300Hz
Suspected Causes and Recommendations
The following suspected causes and corresponding next steps were shared with the customer:
| Suspected Cause | Description | Recommended Test |
|---|---|---|
| Rotor bar defects | Broken or cracked rotor bars causing 100 Hz frequency | Perform motor current signature analysis (MCSA) for rotor bar defects to detect 45/55 Hz sidebands |
| Stator winding faults | Shorted turns or insulation breakdown | Conduct insulation resistance test for stator winding faults |
| Voltage imbalance | Uneven 3-phase supply inducing harmonic distortion | Measure and log line-to-line voltage |
| VFD-induced noise | Harmonics introduced by inverter | Run motor direct-on-line; if harmonics vanish, VFD is the source |
Deployment Context
The monitored pump operates around the clock in the paint shop. The backup system is intended for emergency use only, and switchover requires draining, flushing, and restarting — a process that disrupts production.
One technician remarked: “This runs continuously — 24/7, 365 days. Only other standby we keep for emergencies.” “If this one fails suddenly, we’ll have to clean the tank and flush before switching to the backup.” This highlighted the importance of early warning diagnostics — even when no symptoms are present.
Estimated Value at Stake
Although formal root cause testing was not performed during the demo, similar failures in comparable setups can result in:
- Risk of unplanned maintenance downtime in manufacturing
- ₹50,000–₹1,00,000 in repair and lost production
- 2–4 hours of interruption
- Inefficient use of maintenance resources
- Increased wear on the backup system
- Escalation to full motor or VFD replacement if left unresolved
This case demonstrates how on-the-spot diagnostics with ARGUS can uncover valuable insights, even in unscheduled situations — empowering maintenance teams to move from assumption to informed action.
Customer Reactions
Several key reactions from the customer team captured the moment:
“We didn’t expect anything on this one — the motor was replaced just last year.”
“Can we fix two sensors permanently and get cloud data like this?”
“This kind of early alert is very useful — especially for this type of pump.”